
Earlier work · Research software
SolarConflux
One Sun. Several spacecraft. When do their viewpoints align?
I built SolarConflux to turn spacecraft trajectories into candidate observation windows. It screens useful geometries for coordinated solar and heliospheric observations, then keeps the dates and assumptions together for follow-up analysis.
- My role
- Designer & developer
- Project context
- ESA · 2023–2025
- Today
- Open-source Python & web explorer



The question
A shared view starts with geometry.
Spacecraft sample the heliosphere from different places. Their relative positions help determine which measurements may be useful together, whether for comparing viewpoints or investigating how solar-wind structures evolve with distance.
Searching many trajectories by hand quickly becomes cumbersome. SolarConflux asks a simpler first question: when do the selected bodies satisfy a geometry worth investigating?
From positions to possibilities
Find the geometry first. Interpret it with the observations.
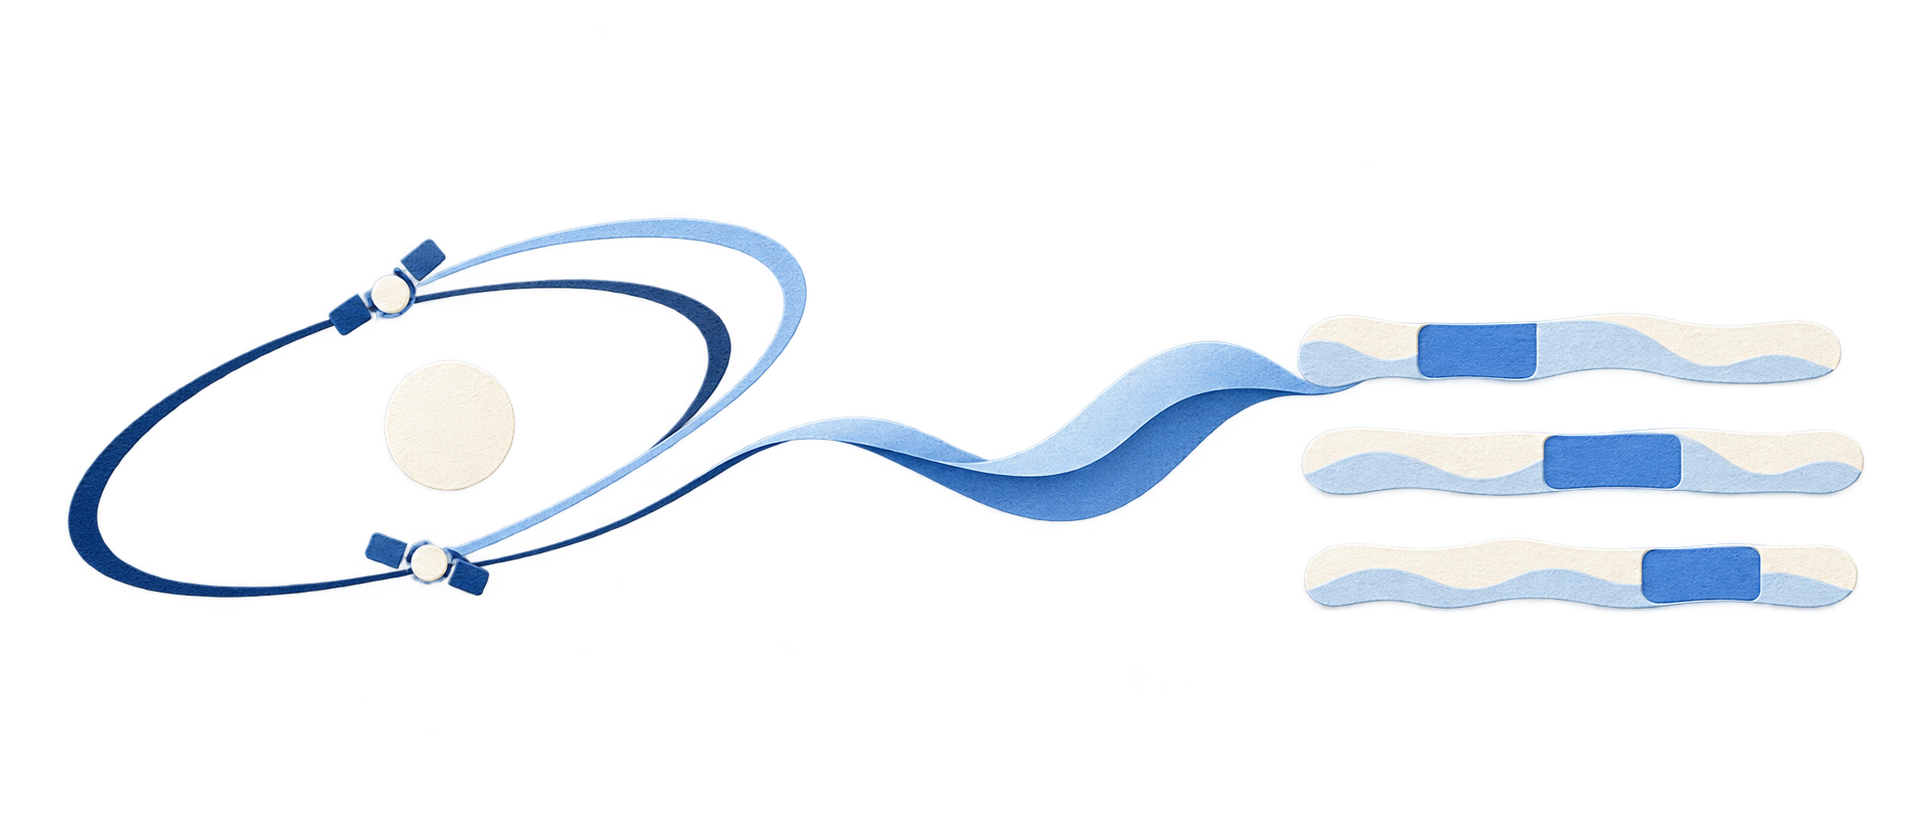
An alignment is a starting point for analysis. It helps shortlist dates; measurements and physical models are needed to establish what the spacecraft actually share.
Approach
From ephemerides to a shortlist.
- Retrieve trajectoriesChoose spacecraft, planets, dates and sampling. Express the ephemerides in a common Sun-centred frame.
- Compare geometriesScreen circular longitude separations or ballistic Parker footpoints, with an optional group latitude filter.
- Find windowsGroup successive matching samples into candidate intervals. Their boundaries follow the sampling cadence.
- Keep the contextExport the windows, settings and data provenance alongside plots for further investigation.
Different geometries, different questions.
Cone
When are observers close in longitude to an anchor body?
Opposition
When are two observers about 180° apart in longitude?
Quadrature
When are two observers about 90° apart in longitude?
Custom angle
When does their separation approach a chosen angle?
Parker spiral
When do approximate ballistic source longitudes agree?
Cone + Parker
When do the sector and Parker criteria both hold?
Diagrams are conceptual. The geometric modes compare longitude; latitude can be filtered separately. Groups share an anchor body; not every pair in a group necessarily meets the criterion. Parker modes use a simplified ballistic approximation.
A worked example · January 2025
What does a candidate window look like?
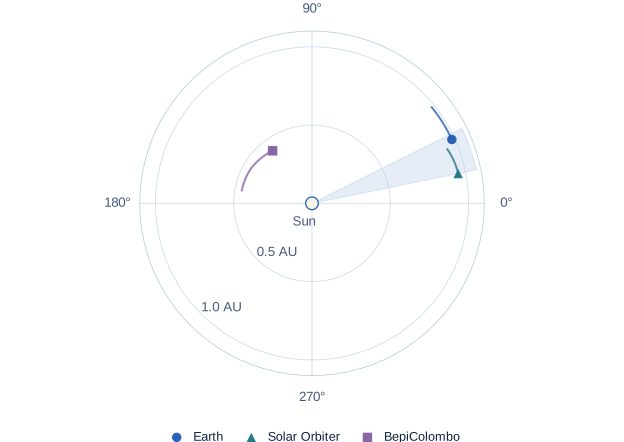
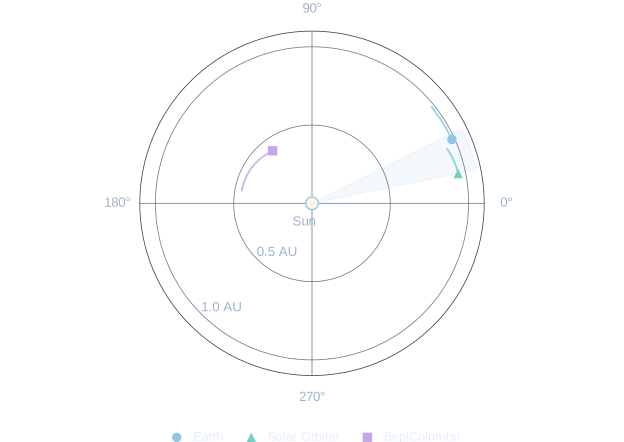
The bundled example contains Earth, Solar Orbiter and BepiColombo. Here, a 15° cone criterion with a 10° latitude-span limit selects one interval for Earth and Solar Orbiter. BepiColombo is shown for context and does not belong to that matched pair.
- Matching pair
- Earth + Solar Orbiter
- Candidate interval · UTC
- 1 Jan 00:00 → 7 Jan 18:00
- Sample spacing
- 6 hours
- Sampled duration
- 162 hours
Where the observers are
When the criterion holds
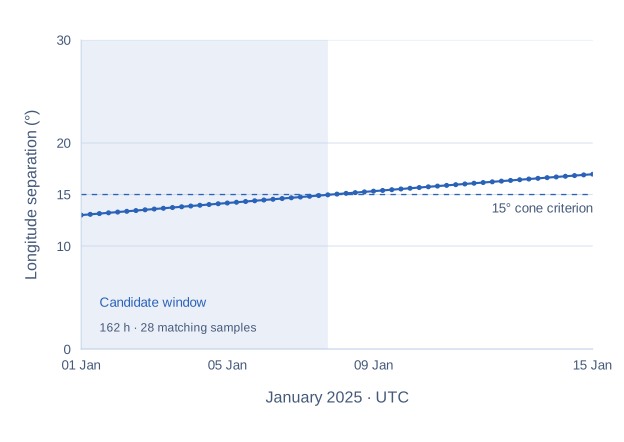
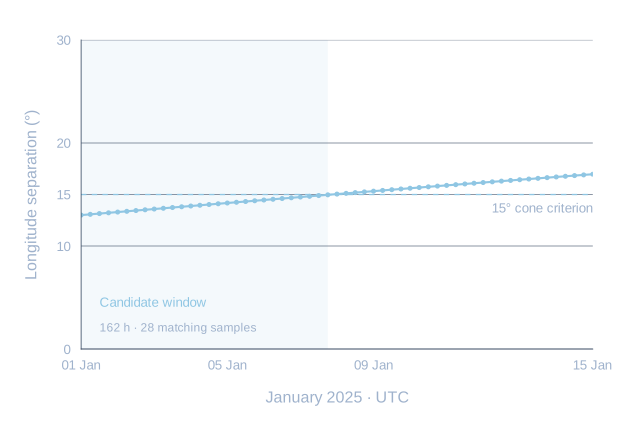
These are sampled boundaries, not exact entry and exit times. The interval begins at the first requested sample, so an earlier start is not inferred. The plots illustrate a geometry, not confirmed shared plasma or magnetic connectivity.
The tool today
Explore, inspect, keep the context.
The web explorer makes the workflow visible: configure observation periods, follow trajectories, inspect matching intervals and export the results. Saved runs can be reopened in History on the same browser.
The bundled example and imported trajectories can be screened without live retrieval. Live ephemerides are retrieved through a separate service; availability depends on the selected bodies, dates and data source.
- Tools
- Python · SunPy · Astropy · Astroquery · NumPy · Matplotlib
- Data
- JPL Horizons · SPICE kernels where available · imported trajectories
- Outputs
- Candidate-window CSVs · run metadata · plots · browser run backups
Python usage & original quick-look figures
Use the Python package
pip install git+https://github.com/EmmaVellard/SolarConflux.gitThe command-line workflow exposes the same screening modes and exports CSVs, run metadata and optional polar plots.
Installation & examplesEarlier output figures
The original cone and Parker quick-look plots remain available. The figures above use the documented January dataset so their inputs and styling can be reproduced.