← Back to projects
Research project

Phobos & Deimos

Spectral analogs · Laboratory validation · MMX preparation

Laboratory validation of UTPS-TB simulants as spectral analogues of Phobos surface, adapted to MMX instrument conditions (OROCHI, MIRS) and compared against CRISM observations.

Overview

Phobos and Deimos origin remains debated between the giant impact and asteroid capture scenarios. This work evaluates whether UTPS-TB (Tagish Lake based) simulants reproduce key spectral behaviours of Phobos, including slope trends and the hydroxyl band region around 2.71 µm.

Problem
Interpreting Phobos spectra for MMX benefits from validated laboratory analogs under mission-like conditions.
Goal
Compare lab spectra to datasets and simulate OROCHI/MIRS-compatible metrics for robust discrimination.

My contribution

I investigated Phobos origin scenarios through laboratory spectroscopy and mission-oriented spectral analysis in the context of JAXA’s MMX mission.

  • Conducted FTIR experiments on Phobos analogue samples and evaluated grain-size effects.
  • Processed and compared laboratory and remote-sensing spectra.
  • Generated OROCHI-band and MIRS-resolution simulations and interpreted them against MMX science objectives.

Scientific context

  • Two dominant hypotheses: impact origin vs capture.
  • UTPS simulants support scenario testing and instrument preparation (Tagish Lake based variants included).
  • MMX interpretation relies strongly on slope and band-depth metrics derived from discrete-band (OROCHI) and NIR (MIRS) observations.

Approach

  • Laboratory reflectance spectroscopy across visible to IR ranges, calibrated with Spectralon and Infragold.
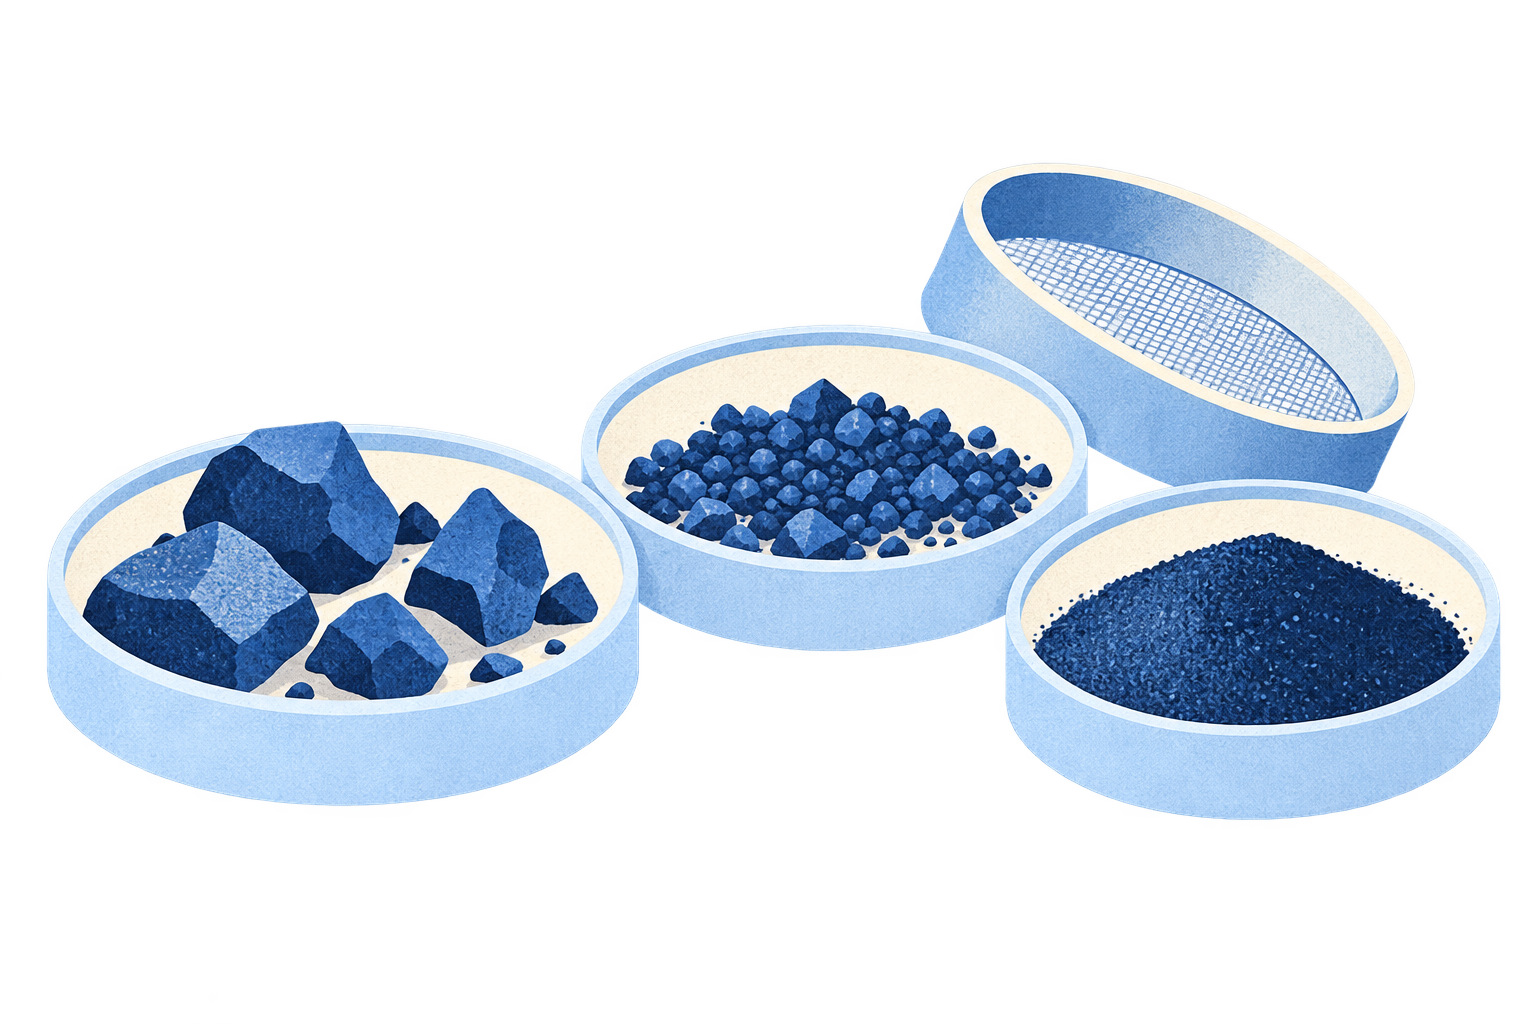
  • Grain size separation and controlled sample handling to evaluate slope and reflectance sensitivity.
  • Simulated band-averaged outputs matching OROCHI filter bands and MIRS resolution.
  • Consideration of thermal emission artefacts affecting the ~3 µm region in remote sensing comparisons.

Key results

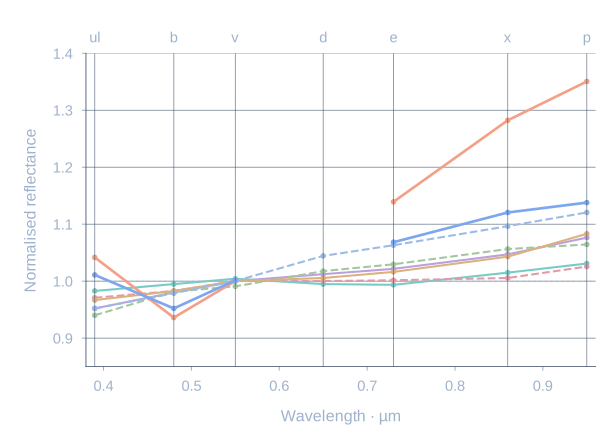
Grain size strongly impacts slope behaviour and reflectance. In OROCHI-band space, finer grain regimes are compatible with observed unit-level trends when using normalized metrics rather than absolute reflectance.

Spectral features
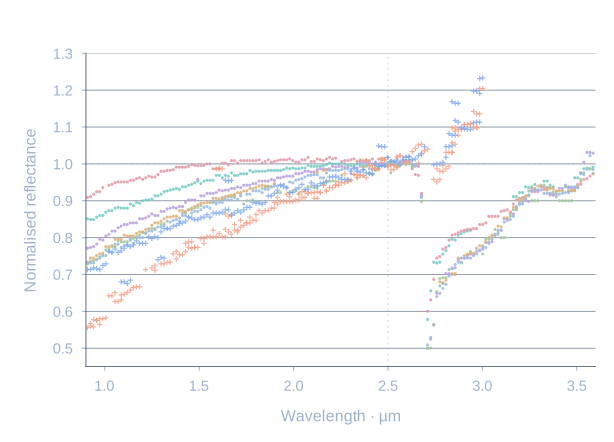
Hydroxyl region around 2.71 µm, plus additional signatures influenced by mineralogy and organics.
Instrument realism
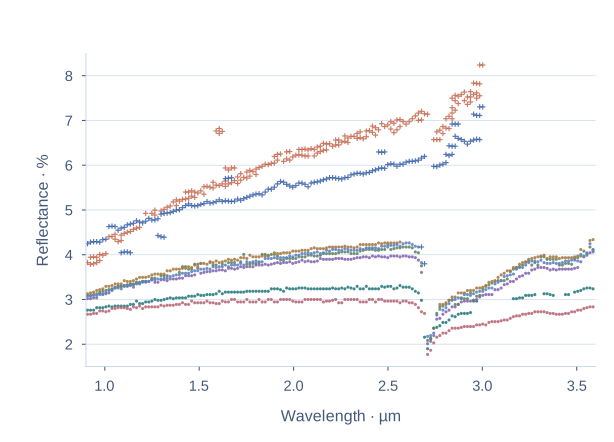
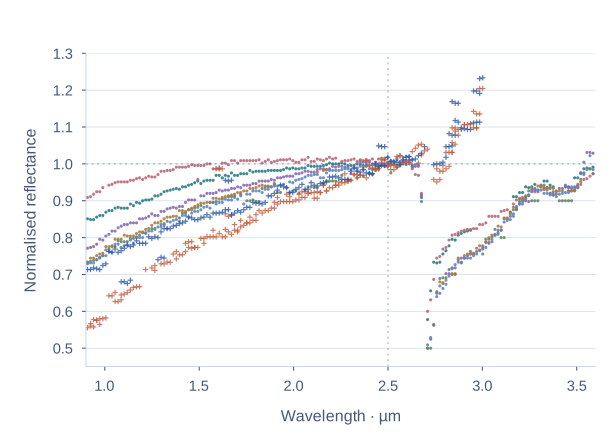
OROCHI slopes remain robust; MIRS comparisons near ~3 µm can be biased by thermal emission even after correction.

Instrument-oriented comparisons

Laboratory analogue spectra were resampled to the observing conditions of the two MMX remote-sensing instruments, connecting sample measurements directly to mission data products.

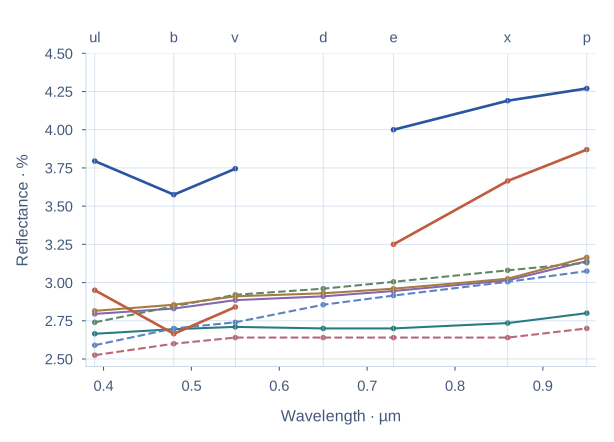
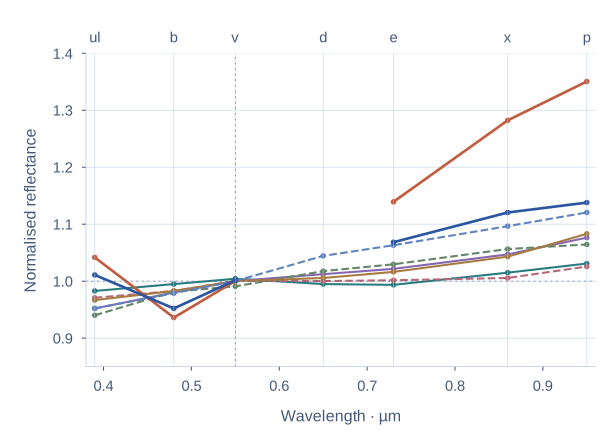
UTPS-TB laboratory analogue and CRISM Phobos spectra sampled in the MMX OROCHI filter bands, shown as reflectance and normalized reflectance
OROCHI simulation. UTPS-TB analogue and CRISM Phobos spectra sampled in the instrument’s discrete filter bands.Research report · Fig. 8
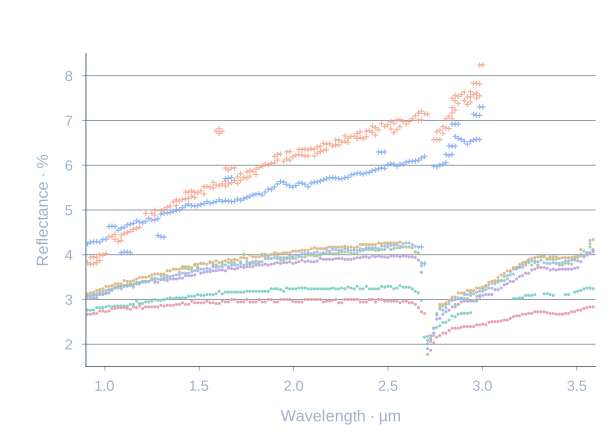
UTPS-TB laboratory analogue and CRISM Phobos spectra resampled to MMX MIRS observing conditions across the near infrared
MIRS simulation. Laboratory analogue and CRISM Phobos spectra resampled to mission-like spectral conditions.Research report · Fig. 10

Interpretation

The analysis shows that grain size, porosity, and the presence of organics significantly control reflectance behaviour. This limits the reliability of spectral slope alone for compositional inference, meaning that similarities with carbonaceous asteroids cannot directly validate a capture origin. Integrating slope-based diagnostics with hydroxyl-region indicators offers a more robust framework to evaluate formation scenarios.

Deliverables

  • Processed laboratory spectra across visible to IR ranges for multiple grain sizes.
  • OROCHI band simulations (band-averaged reflectance, normalized profiles, slope metrics).
  • MIRS-resolution simulations with discussion of thermal emission biases.
  • Interpretation notes linking spectral behaviour to physical controls (grain size, porosity, organics).

Technical implementation

Lab reflectance spectroscopyOROCHI band simulationMIRS-resolution simulationSpectral slope analysisBand-depth metrics (2.7 µm)Grain size sensitivityThermal emission considerationsCRISM comparison