


Occator
Bright deposits & fractures
How do the deposits and surface structures extend beneath the crater floor?
Earlier work · Student mission concept
What lies beneath Ceres' surface clues?
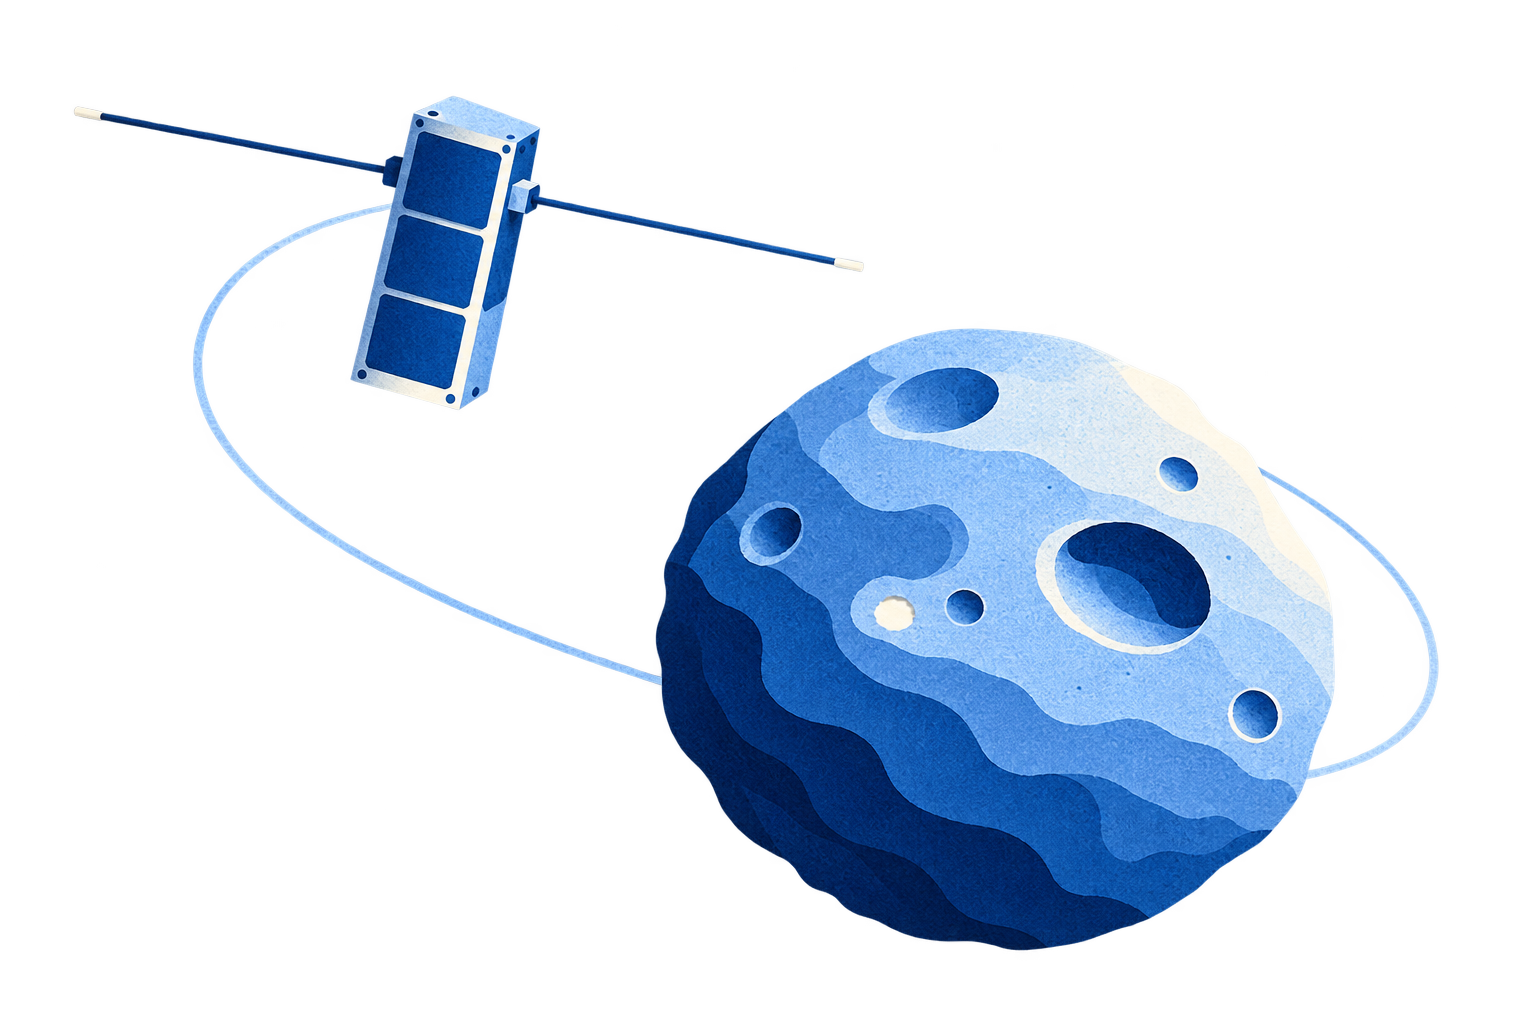
I worked on a team concept for a CubeSat radar sounder at Ceres. Our aim was to connect the craters, bright deposits and cryovolcanic features seen by Dawn to the structures beneath them — and translate that science into an instrument a small spacecraft could carry.
The question
Dawn revealed a world shaped by impacts and water-related processes: bright salt deposits, fractures and the cryovolcanic dome of Ahuna Mons. These surface clues raise another question: how do surface geology and shallow subsurface structure connect?
The proposed radar profiles would complement images and spectra. Interfaces, layering and deposit thickness could help test interpretations of how these features formed, and how material moved through or across the shallow crust.
Bright deposits & fractures
How do the deposits and surface structures extend beneath the crater floor?
Cryovolcanic dome
What contacts and internal structures could help reconstruct the dome's formation?
Young impact crater
What is the geometry of crater-floor units and material moved down its slopes?
Complex impact basin
How are its deposits, central structures and varied surface materials arranged in depth?
Below the surface
A radar sounder transmits an electromagnetic signal towards the ground. Part returns from the surface; part can penetrate and reflect where electrical properties change. The timing and strength of the echoes reveal possible interfaces.
A sequence of profiles along the orbit builds a radargram. Converting delay into depth requires an assumed wave speed in the material. Off-nadir surface echoes can also mimic deeper returns, so interpretation needs terrain information.
An interface is a structural clue: an echo alone does not uniquely identify composition or prove the presence of brines.
The study targeted sounding to tens of metres at metre-scale vertical resolution. Its design summary reports about 2.1 m vertical resolution under the assumed dielectric properties; achievable depth would depend on attenuation, terrain and signal detectability.
The trade-offs
Resolution, penetration and instrument size belong to the same problem. A useful measurement has to fit both the geology and the spacecraft.
Bandwidth sets the ability to separate nearby interfaces. Frequency and material attenuation influence how far the signal can penetrate.
Altitude and surface slopes change the echo geometry, signal strength and surface clutter. They also shape the timing of the observation.
A long antenna must fit into a small spacecraft, then deploy reliably. Radar transmission and processing share its limited power and data budget.
Figure 4.21 compares the reported signal-to-noise ratio at three orbital altitudes as surface RMS slope increases. It uses a modelled interface at 60 m depth and fixed assumptions for reflectivity, attenuation and receiver noise.
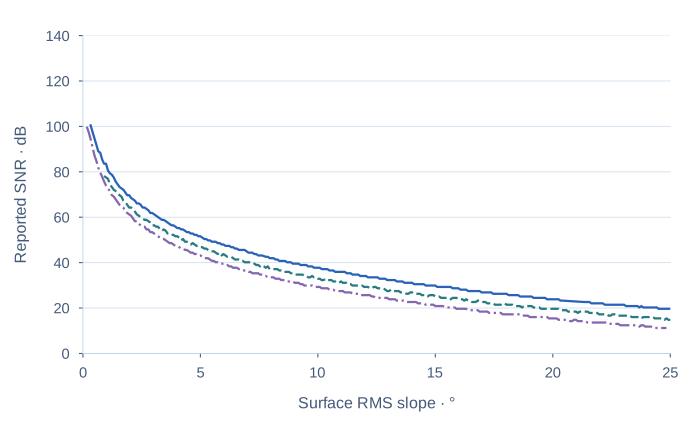
The trend is a design driver. In the report's calculation, increasing roughness and altitude reduces the reported signal-to-noise ratio: terrain selection and orbit design matter together.
The numbers remain conditional. The original calculation and dB conversion have not been independently reproduced; this comparison does not establish an achievable sounding depth or flight readiness.
The study
Diplona was an early student feasibility study. Its value lies in making the chain from science objectives to instrument requirements explicit — and documenting the choices in a shared team report.
A science rationale and target shortlist, a radar payload concept, spacecraft sizing, observing orbits and an operations concept connecting the measurement to mission constraints.
Antenna deployment, instrument performance, clutter rejection, power and thermal budgets, navigation and transfer architecture would need further engineering and testing.
The February 2023 report lists twelve co-authors, including Emma Vellard, from ESTACA and the Planetary Science and Space Exploration MSc. It presents an early mission concept and a potential Phase 0 study. The outputs described here belong to the team; the report does not assign named individual responsibilities.
Study conclusion · p. 96Table 4.6 summarises a 7.3 m dipole, 30 MHz centre frequency, 40 MHz bandwidth, 1 W instantaneous transmit power and about 2.1 m vertical resolution. These are proposed design values; penetration and resolution depend on assumed dielectric properties and attenuation.
Design summary · Table 4.6The graph was redrawn from the JPEG embedded in the report, without original numerical outputs. Compression, overlapping traces and limited resolution near zero slope prevent exact coordinate recovery. The downloadable points reproduce the visible comparison; they are not suitable for engineering calculations. The underlying radar calculation and dB conversion were not independently validated.
Digitisation method & limitationsThe paper illustrations explain the mission idea; they are not spacecraft drawings or observations of the subsurface. The radar diagram shows hypothetical interfaces, which would not uniquely establish composition or brines.
Original spacecraft geometry · Fig. 4.4